A financial tracking tool designed to simplify
irregular cash flow management.
Investio
User Growth
FinTech App
MVP


Timeline
9 Weeks
Tools
Figma
Axure
My Role
User & Market Research
UX Design
User Interface Redesign
Product Management
Work Project
Product Manager*1
Product Designer*1
Software Engineer*3
QA Engineer*1


Onboard: Beginner’s Guide

Record Transactions


Track/View Returns


Share with friends


Solution Overview
The goal of this MVP is to conduct internal testing, evaluating usability and assessing members' willingness to refer.
To support the essential user flows, I prioritized three core features: Onboarding, Transactions, & Customer referrals
Homepage

⭐ Wallet
Profiles


Main Pages
Background
From 2021 to 2022, I was part of a startup that specializes in providing online finance courses and supplementary products, containing the bond calculator, fund screener, annuity calculator, etc.
Level 2 : Intermediate courses
Level 3 : Advanced courses
Online Finance courses
Main Services
Offering 3 levels of courses: Level 1 is free; Level 2 & 3 are paid services that include additional courses, extra resources and long-term interests.
Entry and Mid-Level Investors
👨🏻🦳
👨🏻🌾
👩🏻🍼
Existing Customer Groups
60% of our users are 45+, predominantly store owners or retirees with disposable income and time, yet often lacking in investment experience.
Our Team
How to Drive User Referrals by Offering an Ancillary Tool?
As a team that focuses on #User Growth, user acquisition and referral are essential metrics in our pursuit of success. We usually start by optimizing the AARRR Funnel (*A framework used to optimize the growth journey in 5 stages: Acquisition, Activation, Retention, Revenue, and Referral.)
Course Members
Finance tracking tOOL
New Customers
Utilize
Refer / Invite
Why Design
Entry and mid-level investors Need tools to assist them managing investments alongside the online courses.
(1) According to the existing customer profiles, entry and mid-level investors are our main user group.
(2) We regularly review the customer feedback to ensure our course members are enjoying their time with our services.
I found that actual investment are much harder...There’re many cash flows, which makes implementation more difficult.
“
The courses are tightly scheduled, and beginners like me find it a bit overwhelming to start investing.
“
I would suggest providing tools to help us learn and invest, with instructors teaching their usage in class.
“
I have trouble understanding and managing the uneven cash flows and XIRR...it‘s pretty time-consuming.
“
Our Process
PHASE 1
PHASE 2
PHASE 3
PHASE 4
PHASE 5
1st round user research
2nd round user research
UI Design
Evaluate opportunities
Initial draft
Final draft
Product & UX reviews
Testing
Market research
My Contribution
Market Research + User Research + Brainstorm + UX Flows + UI Redesign
Scheduled meetings & tasks + Ensuring On-time deliverables
Understanding User Needs
Survey

Method: Survey
To get direct feedback from the target & potential users, I created a 7 - minute survey on learning their preferences.
participants
I sent out surveys to existing course members on our main platform where they can utilize a range of resources.
Responses
The survey has been filled out by 5,058 potential users where 90% of them are existing customers.
💡 User Research Findings
Limited Knowledge: Though respondents pay close attention to their investment performance, only a few of them have a general understanding of the annualized returns of investments. Meanwhile, less than one-third of respondents can accurately calculate XIRR.
Investing Habits: Most respondents show strong interests in financial tools that could assist investing and would like to introduce them to friends.
Willingness to Use: The majority of finance apps in the market only provide absolute returns (e.g., the cumulative rate of return), which could not cater to users' need to understand the actual investment performance.
Understanding Market
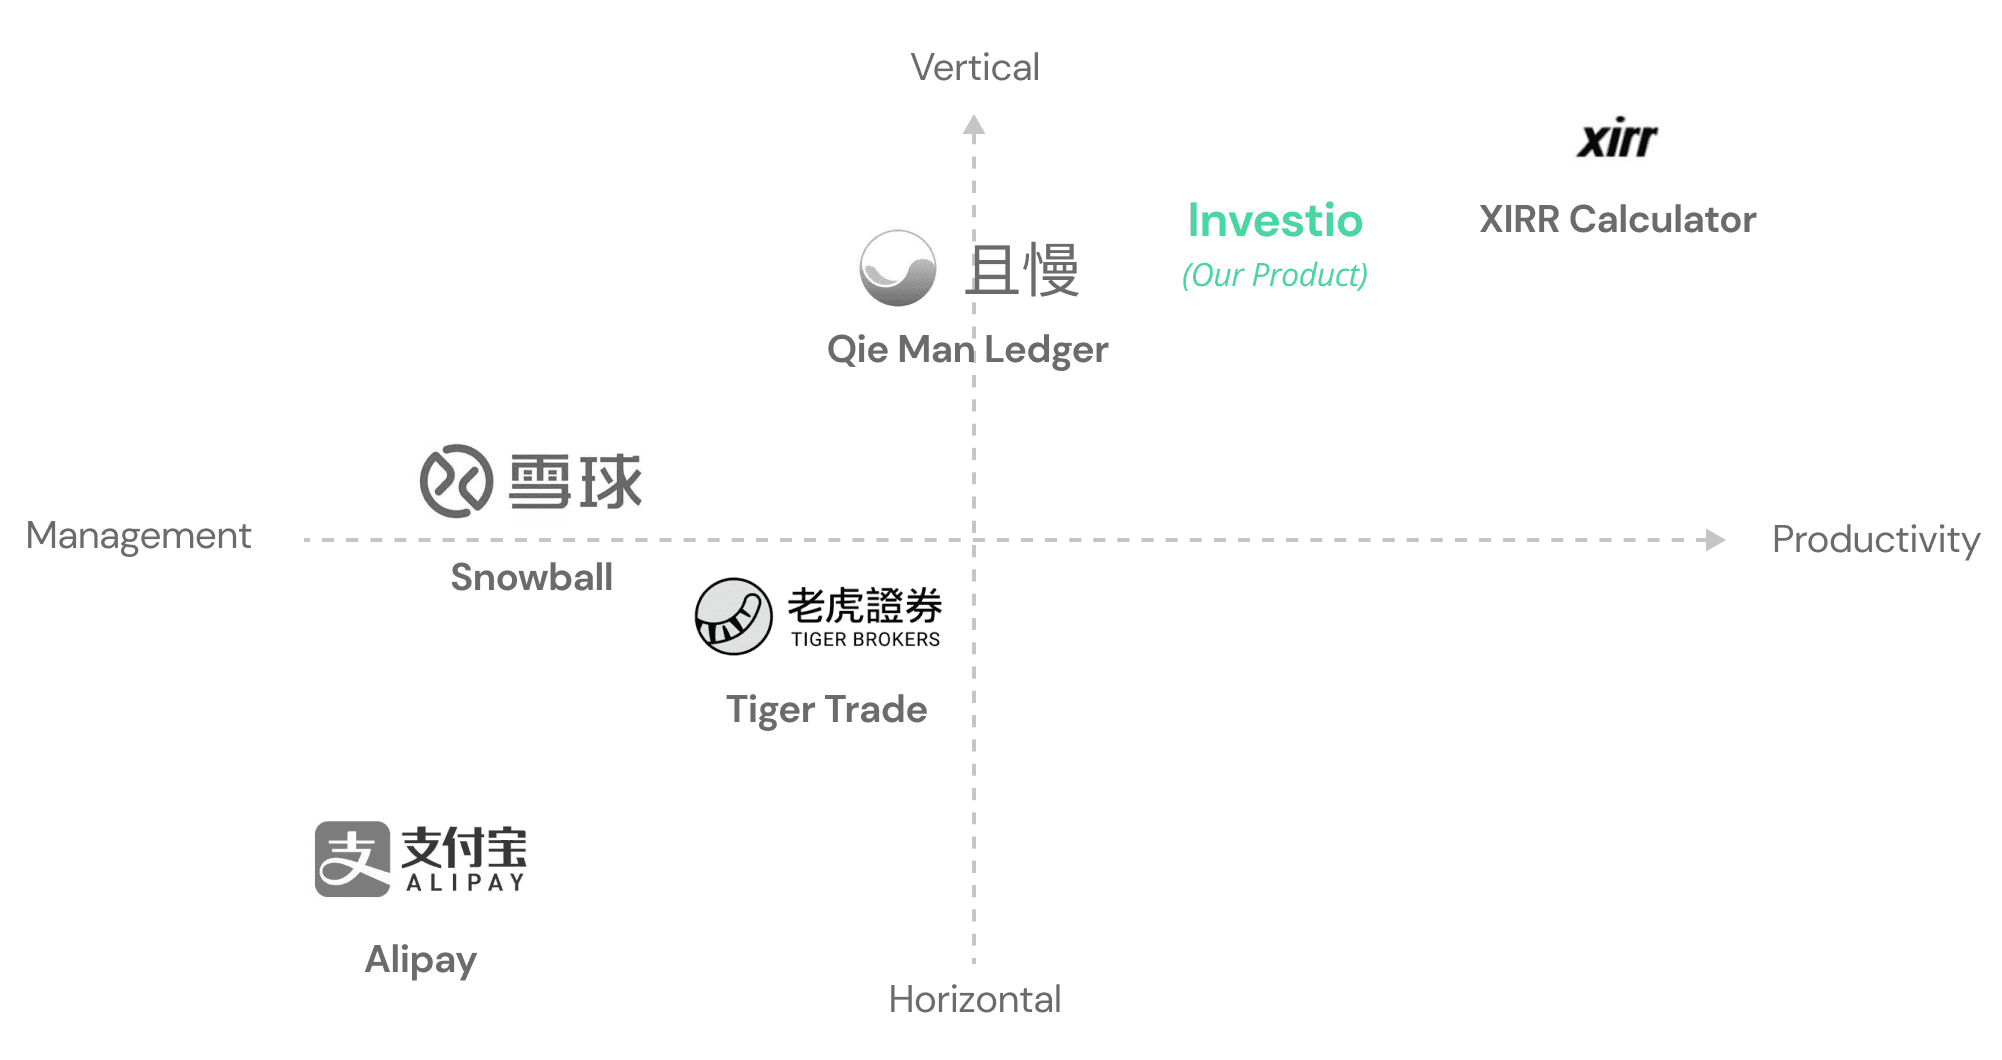
Positioning Matrix
To grasp the target market and uncover opportunities, we compared our value proposition with other personal finance APPs in China.
💡 Market Research Findings
Investment Returns: The annualized rate of return on investment is a frequently used ratio for evaluating gain/loss on investments relative to its cost. However, most competitors pay more attention to the cumulative return than the annualized index, and hence, investors may have difficulties measuring profitability.
Competitors’ Focus: Rather than the overall performance, some competitors are more concerned with the returns of portfolios offered on their own apps/websites.
Referral Gaps: Some competitors do not have referral programs, while some only have unclear buttons that are difficult for users to refer.
Opportunities...
Design a MVP to empower existing course members with better control over their irregular cash flows, and encourage them to refer our products, thus promoting organic growth.
✨ Regularly Recording
Tracking cash flows
Updating changes in assets
✨ Accurate Tracking
Calculating annualized returns over time
Showing trends with return curves
✨ Referral Incentives
Set rules for rewards (e.g., invite 1 friend, earn X).
Allow users to track their inviting progress
✨ Easy Withdrawal
Offer easy withdrawal options
Set daily/monthly limits to prevent misuse
Framing Solutions
Information Architecture

Start with main Pages...
· Homepage: Contains operational campaigns & tutorials.
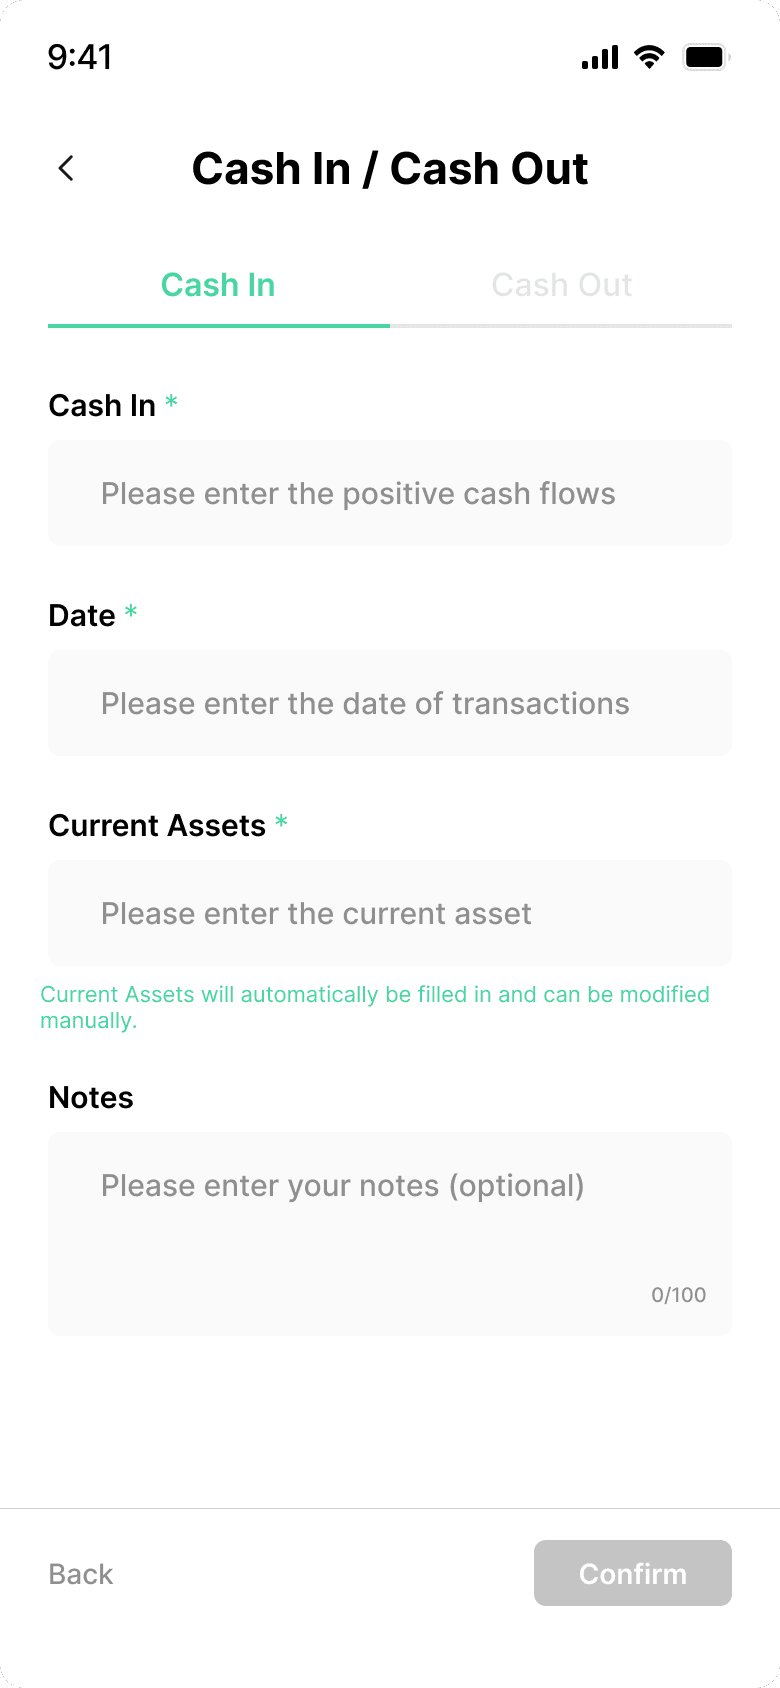
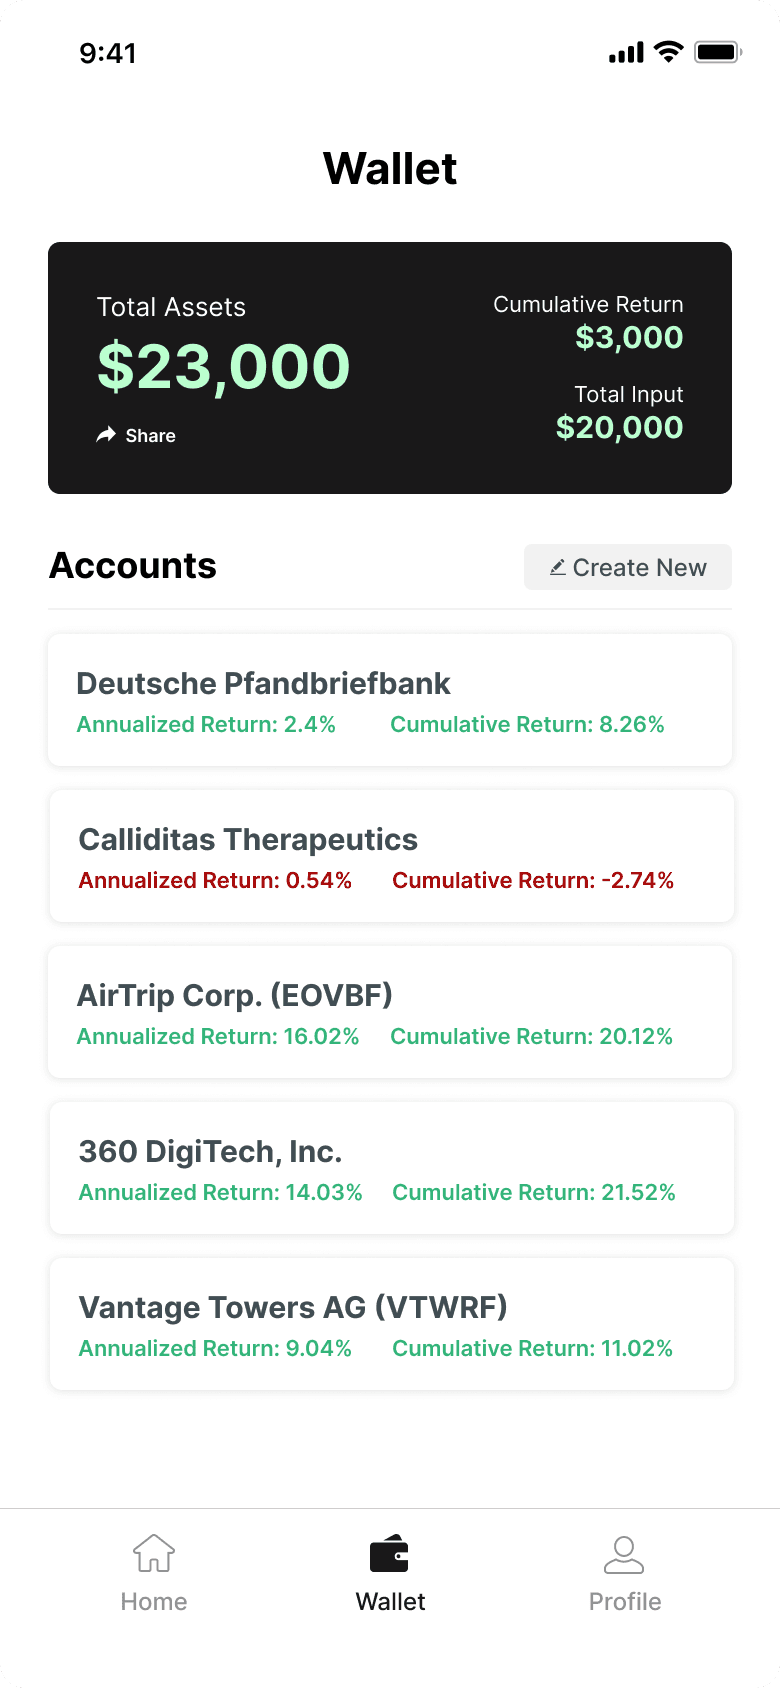
· Wallet: Allow users to manage accounts in their wallets by adding cash flows, updating assets, and tracking annualized returns.
· Profile: A space for user referrals, sharing feedbacks, and other ancillary features/settings.
Homepage

⭐ Wallet

Profiles

Design Challenges
01. Regular Recording + Accurate Tracking
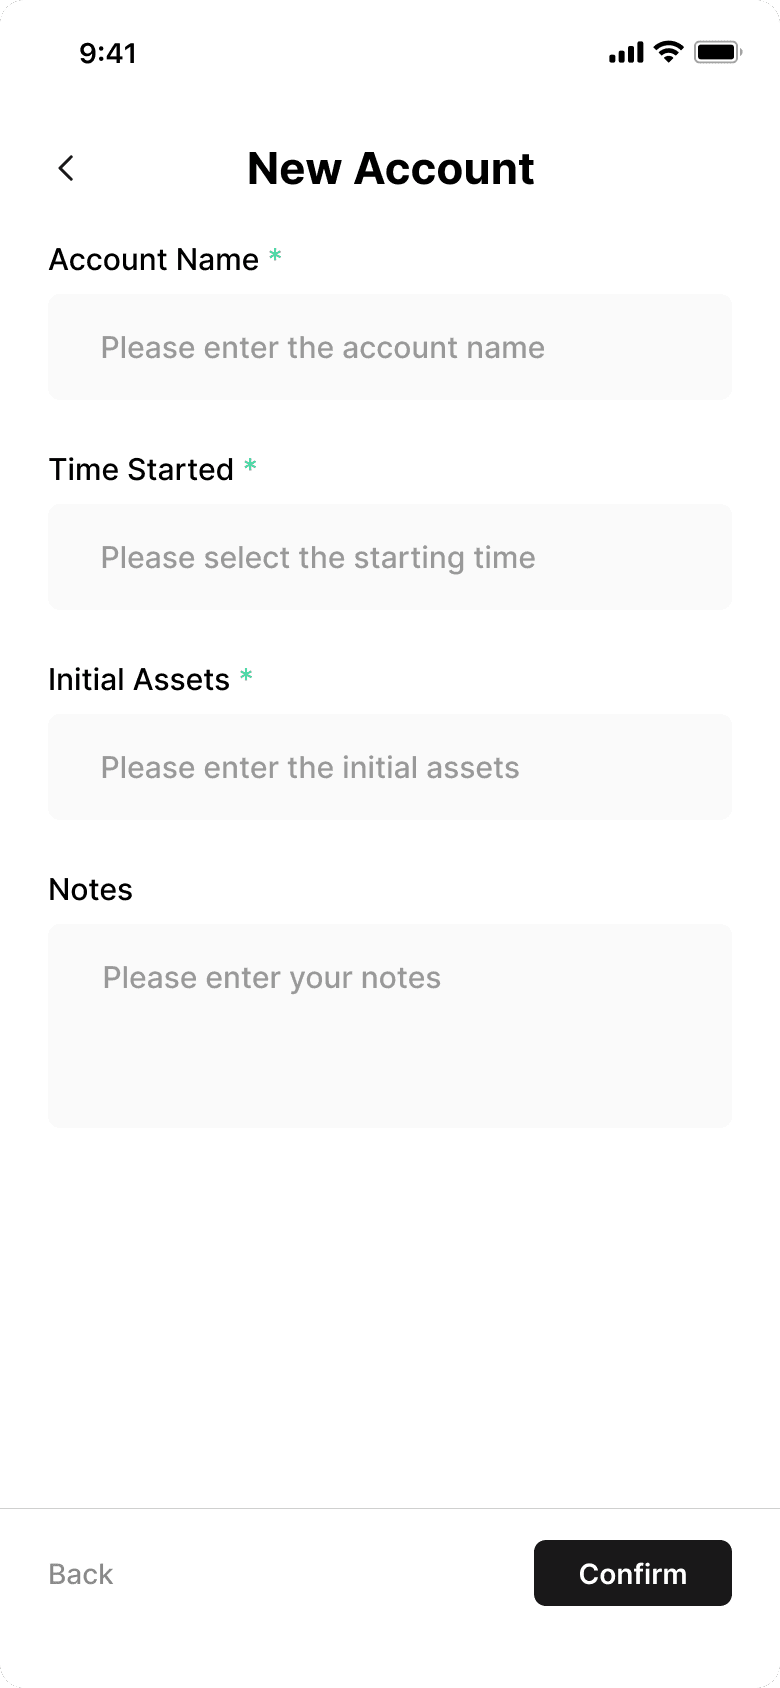
Create: New Account
The prototypes below only highlight the major steps. For full details and access to all prototypes, feel free to contact me via email/LinkedIn.
Wallet
Create Account
Account (Empty)
Account (Edit)

Record: Assets and Cash Flows
Cash Flows
Cash Flow Records
Assets
Assets Records


Track: annualized returns over time
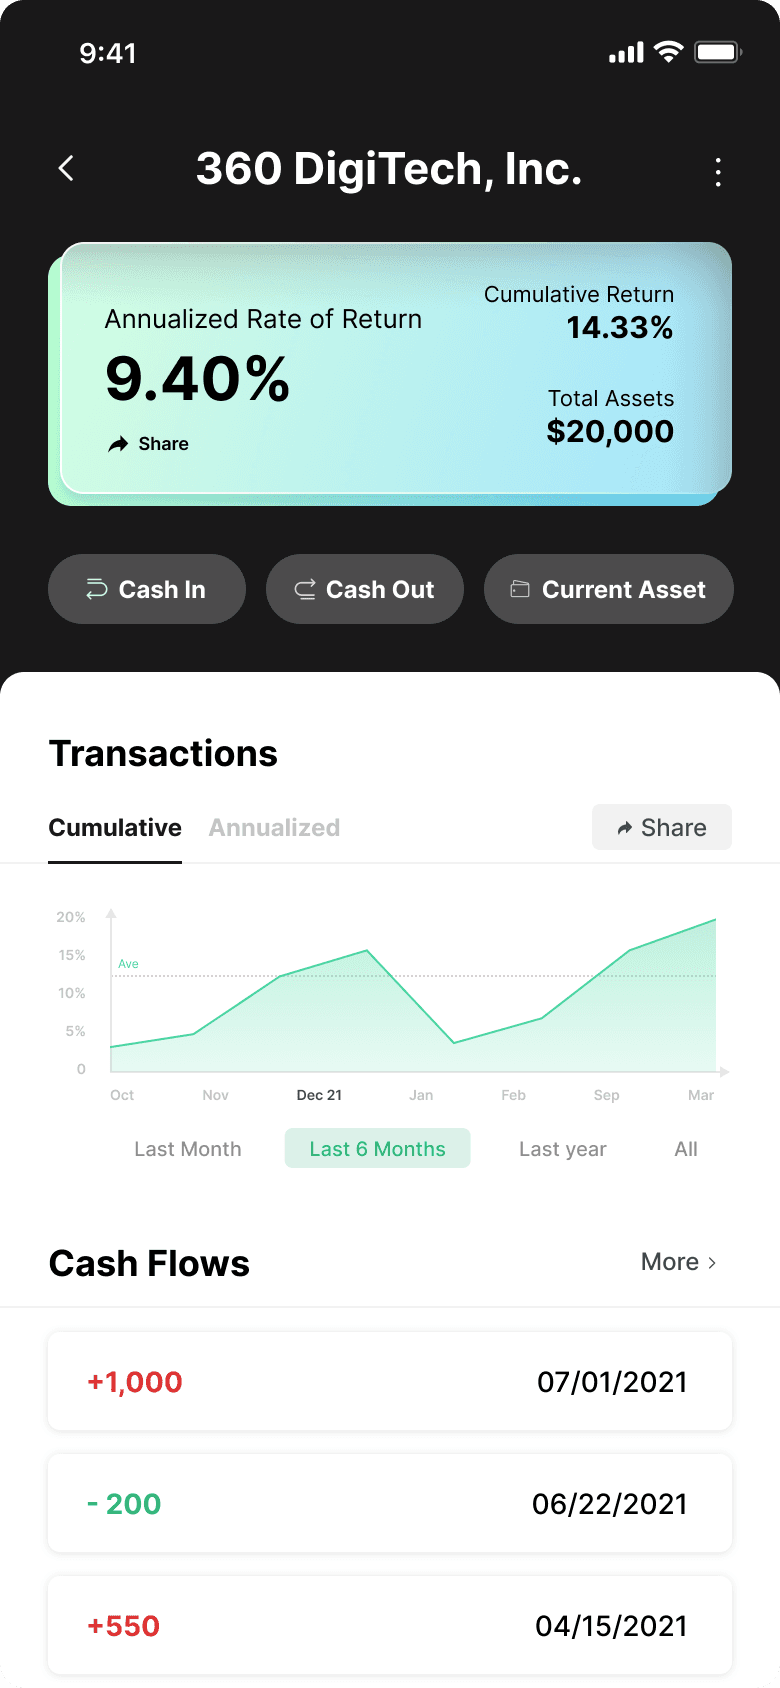
🔎 Top Card (Performance Overview)
Displays key metrics—Annualized Return, Cumulative Return, and Total Assets—for a quick snapshot of investment performance. This reassures users by providing key figures at a glance, fostering trust.
✍🏻 Action Buttons (Controls)
The "Cash In," "Cash Out," and "Current Asset" buttons are prominently placed, providing users with straightforward access to critical financial actions.
📉 Return Trends
The transaction graph uses a line chart format to illustrate performance trends over time.
Toggle options for “Last Month,” “Last 6 Months,” “Last Year,” and “All” allow users to personalize their view based on preferred timeframe.
📋 Cash Flow List
The cash flow list presents a chronological breakdown of transactions, making it easy for users to review individual records.
Each entry is formatted with color-coded indicators (+red for deposits, -green for withdrawals), improving clarity.
02. Referral Incentives + Easy Withdrawal
Referral Program: Iteration 1
Share

Notify

Referral Program: Iteration 2
“Incentive is the key part of a product referral design.”


Total Rewards + Withdrawable Amount
Cash for referer, Free Courses for referee
Referral Progress: whether they register or take courses
Track Progress


Claim Rewards

User Referral
The prototypes below highlight the major steps. For full details and access to all prototypes, feel free to contact me via email or LinkedIn.
Profile Page
Referral Page
Refer
Notifications
Michael Lee
User ID: 11223
Edit Profile

Profile
Home
Wallet
Profile

Refer Friends

Recently Deleted


Feedback


Settings


Black Friday Sale
Saving $9.99 for each course
Strengthen your skills by taking personal finance courses online

Refer Friends
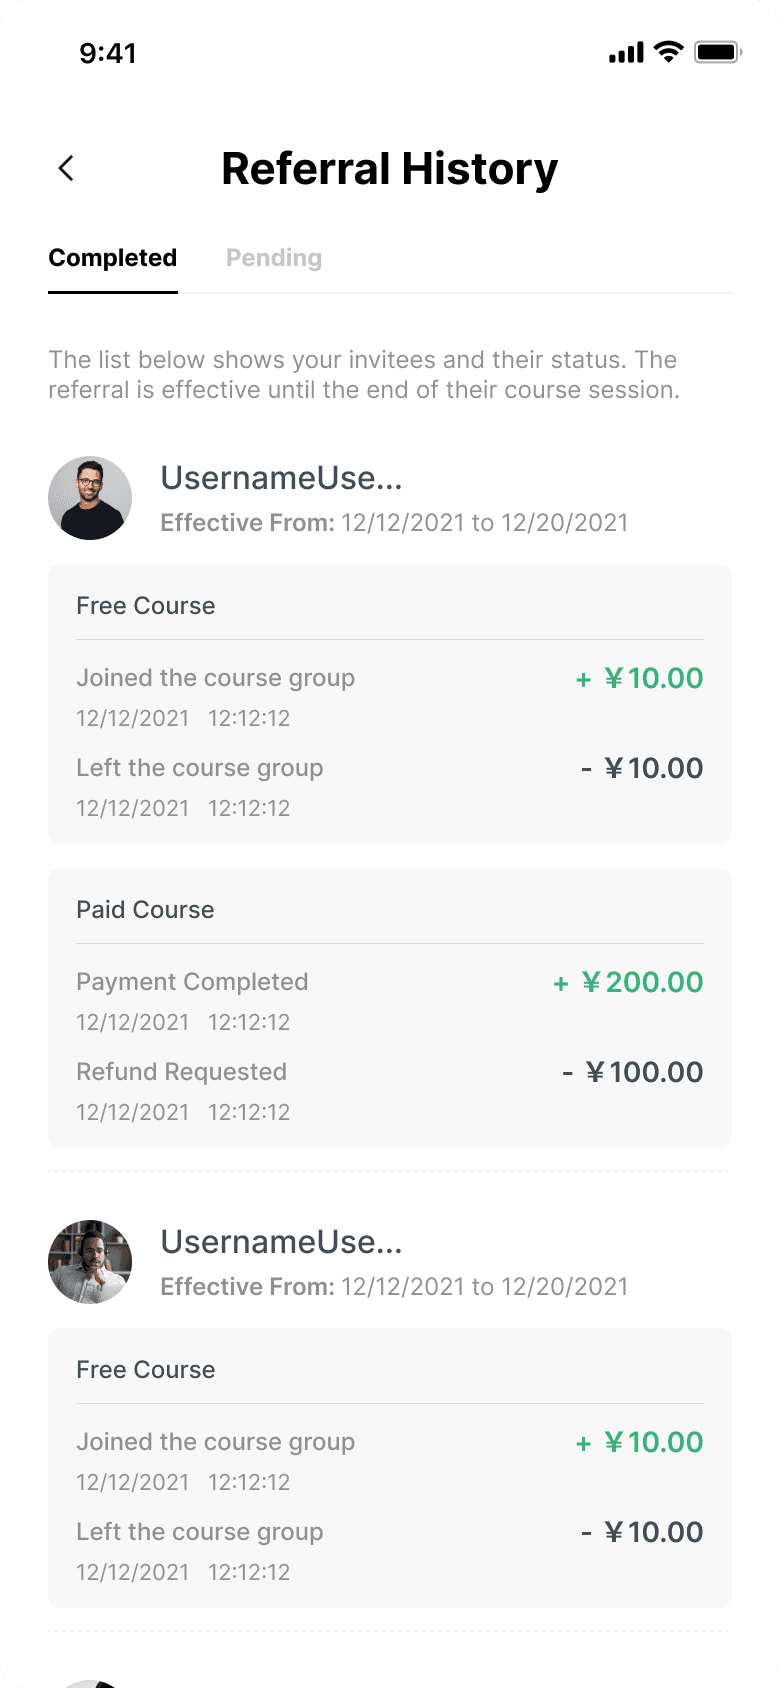
¥10 for each referral
Invite your friends to explore our online courses! Earn ¥10 for each who joins a class.
Rewards
Withdraw Rewards
¥12324.00
Total Rewards
¥268.00
Withdrawal Rewards
Total Invites (37)
More

Invite Friends to Free Courses
Share to
Black Friday Sale

Personal & Family Financial Planning

Scan the QR code to save ¥9.99 per class
Report
Moments
Copy Link
Download
Refresh

Well done!
You have successfully shared it to your friend.
Impact & Data
Number of users
Retention Time
DAU & Retention
Feedback submitted at end of Journey
User Satisfaction & Feedback
A/B testing to monitor acquisition and referral rates.
Referral Rates
Also utilize A/B testing to monitor ROIs based on multiple landing pages.
ROI
5k+
Daily Active Users
80%
Positive Feedback
+10%
Referral Rates
60+
Return on Investments



Contact for all prototypes
Other Process
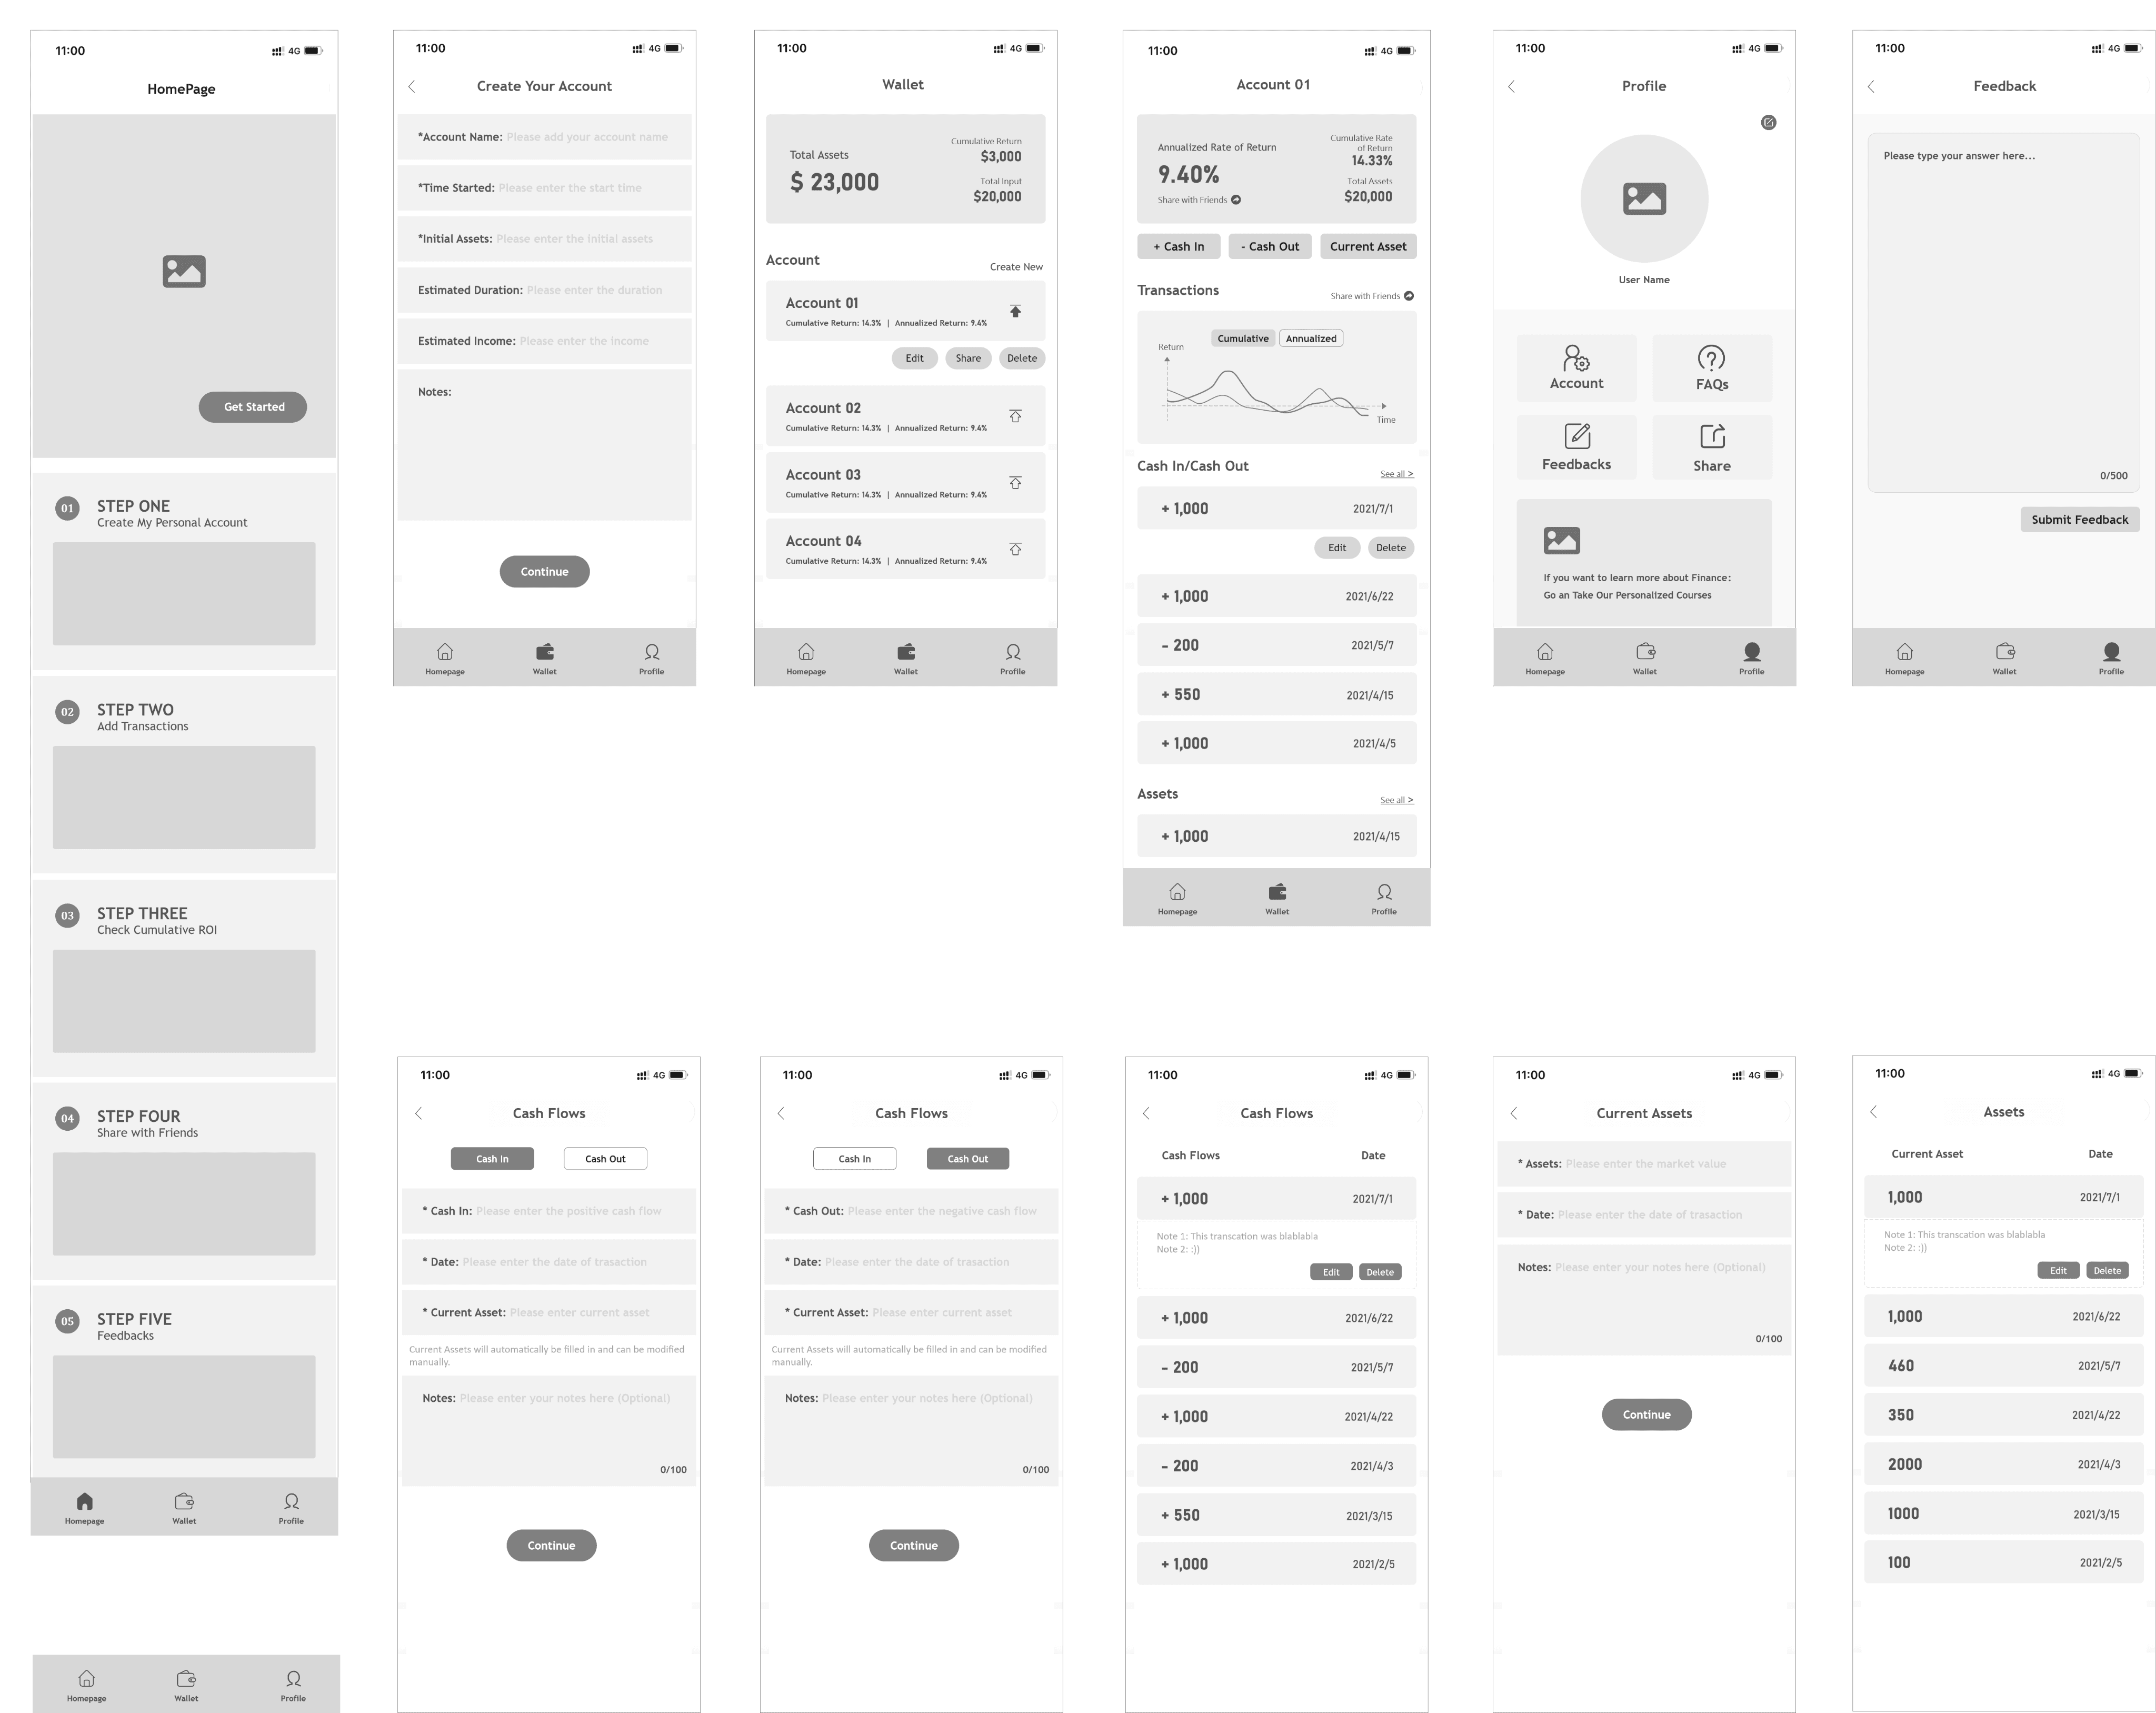
Wireframing
Onboarding
Create initial account
Cash in
Wallet
Cash Out
Account 1
Cashflow records
Profile
Update Assets
Feedback
Asset records
Style Guide
I selected the Inter font because it maintains great readability and is one of the most popular fonts used for mobile apps. As for the color scheme, I was inspired by the colors in the stock market, since the green and red colors represent a kind of trend. Also, the color black represents the feeling of formal, sophisticated, being strong.
Font
Inter
Regular abcdefghijklmnopqrstyvwxyz
Medium abcdefghijklmnopqrstyvwxyz
SemiBold 1234567890
Bold 987654321
Primary Colors
# 46D6A2
# A40202
# F3FFFB
# F3FFFB
# 33B47A
UI Components

01. Respondents who are relatively experienced investors have more urgent needs for better controlling the uneven cashflows.
02. Some experienced investors we interviewed said they usually use Excel to calculate the XIRR rate every week/month/season. So that if we could launch a product that integrates the function of XIRR and other investment indicators, they are very likely to use and share.
03. Most respondents show a strong interest in financial tools. However, many of them are “Entry-level” investors who could not handle their investment independently. Therefore, we need to provide detailed functional training on the onboarding page.
Reflections
Thank you for visiting👋🏻 Copyright © 2024 Jinjin Du, All Rights Reserved